| | WEEK OF JAN 12 | | Wednesday, Jan 14 |
| Jan 14
10:00am | | Free
| | |
| Jan 14
5:00pm | | Free
 | | |
| Jan 14
5:30pm | | Free
 | | |
| Jan 14
6:00pm | | Free
 | | |
| Jan 14
6:00pm | | Free
| | |
| Jan 14
6:00pm | | Free
| | Stablecon Salon
Venue, To Be Announced
With Aadil Mamujee (Product Leader, Bridge). |
|
| Jan 14
7:00pm | | $20 | | | | | | Thursday, Jan 15 |
| Jan 15
1:00pm | | Free
| | |
| Jan 15
4:30pm | | $65 | | |
| Jan 15
5:00pm | | Free
| | |
| Jan 15
5:30pm | | | | |
| Jan 15
5:30pm | | Free
| | |
| Jan 15
6:00pm | | Free
| | |
| Jan 15
6:00pm | | Free
| | |
| Jan 15
6:00pm | | Free
| | |
| Jan 15
6:00pm | | Free
| | |
| Jan 15
6:00pm | | Free
| | |
| Jan 15
6:00pm | | Free
| | |
| Jan 15
6:00pm | | Free
| | |
| Jan 15
6:00pm | | Free
| | |
| Jan 15
6:00pm | | Free
| | |
| Jan 15
6:00pm | | $45 | | |
| Jan 15
6:30pm | | Free
| | |
| Jan 15
6:30pm | | $35 | | |
| Jan 15
7:00pm | | Free
| | |
| Jan 15
7:00pm | | Free
| | |
| Jan 15
7:00pm | | Free
| | | | | | Friday, Jan 16 |
| Jan 16
10:00am | | Free
| | The Age Of Extraction
P&T Knitwear, 180 Orchard St
With Tim Wu (Author, The Age Of Extraction), Bradley Tusk (Tusk Venture Partners), Nate Loewentheil (Commonweal Ventures). |
|
| Jan 16
5:00pm | | Free
| | |
| Jan 16
6:30pm | | Free
| | |
| Jan 16
7:00pm | | Free
| | | | | | Saturday, Jan 17 |
| Jan 17
11:00am | | Free
| | |
| Jan 17
3:00pm | | Free
| | |
| | | WEEK OF JAN 19 | | Monday, Jan 19 |
| Jan 19
6:00pm | | $5 | | Decoding Careers At The China x Tech Intersection
Pier 57, 25 11th Ave
With Chenni Xu (Corp Comms lead, Nubank), Selina Xu (China & AI Policy Lead, Office of Eric Schmidt), Jordan Schneider (Founder, ChinaTalk), Savannah Billman (Founder, Career China). |
|
| Jan 19
7:00pm | | $7 | | | | | | Tuesday, Jan 20 |
| Jan 20
5:00pm | | Free
| | |
| Jan 20
5:30pm | | Free
| | Friends & Founders Mixer
Venue, To Be Announced
Demos by Arbon, Cella Mineral Storage, ICODOS, Lite-1, Mission Zero, Octavia Carbon, Rushnu, Sora Fuel, Turnover Labs, Universal Matter. |
|
| Jan 20
6:00pm | | Free
| | |
| Jan 20
6:00pm | | Free
| | |
| Jan 20
6:00pm | | Free
| | |
| Jan 20
6:30pm | | $15 | | |
| Jan 20
6:30pm | | Free
| | |
| Jan 20
7:00pm | | $7 | | |
| Jan 20
7:00pm | | $20 | | |
| Jan 20
7:00pm | | Free
| | | | | | Wednesday, Jan 21 |
| Jan 21
7:00am | | Free
| | Microsoft AI Tour
Javits Center, 429 11th Ave
With Alysa Taylor (CMO Commercial Cloud & AI, Microsoft), Jenny Lay-Flurrie (Chief Accessibility Officer, Microsoft), Tracy Galloway (COO, Microsoft Americas). |
|
| Jan 21
10:00am | | Free
| | |
| Jan 21
2:00pm | | $250 | | |
| Jan 21
5:00pm | | Free
| | Agentic Era - New Rules Of Embedded Acquisition In Insurance
Venue, To Be Announced
With Maya Prosor (CBO, Lemonade), Tim Stevens (COO, Quinst), Parvathi Narayan (CPO, Prudential Life), Todd Friedman (AI Shopping Lead, Google], Alex Springer (AI Strategy, Impact). |
|
| Jan 21
5:00pm | | Free
| | NYC VC Investors - Winter 2026 Mixer
Venue, To Be Announced
With Derek Wu (Fin Capital), Andrew Chang (Lynx Collective), Dorothy Chang (Flybridge), Alex Rea & David Concannon (Goodwin).
|
|
| Jan 21
5:30pm | | Free
| | |
| Jan 21
6:00pm | | $77 | | |
| Jan 21
6:00pm | | Free
| | |
| Jan 21
6:00pm | | Free
| | |
| Jan 21
6:00pm | | Free
| | |
| Jan 21
6:00pm | | Free
| | |
| Jan 21
6:15pm | | Free
| | |
| Jan 21
6:30pm | | $25 | | Undimmed
P&T Knitwear, 180 Orchard St
With Cecily Mak (Founder, Wisdom Ventures & Author, Undimmed). |
|
| Jan 21
6:30pm | | Free
| | |
| Jan 21
7:00pm | | Free
| | | | | | Thursday, Jan 22 |
| Jan 22
12:00am | | Free
| | |
| Jan 22
7:00am | | $155 | | |
| Jan 22
4:00pm | | Free
| | Dry January Founder Mixer
WeWork, 85 Broad St, 18th Fl
With founders Cullie Poseria (The Bar Nun Life), Aqxyl Storms (Minus Moonshine), Charlotte Mizrahi (Ley Line Labs), Ed Carino (ProofNoMore). |
|
| Jan 22
5:30pm | | Free
| | |
| Jan 22
6:00pm | | $45 | | |
| Jan 22
6:00pm | | Free
| | |
| Jan 22
6:00pm | | Free
| | Staying Up To Date w/ The Industry
Venue, To Be Announced
With Jan Leenknegt (Dir., Bjarke Ingels Group), Aditi Patel (Head of Virtual Design, LiRo-Hill), Bob Yori (Digital Solns, AECOME), Charlie Portelli (Product, Flux), Clay Starr (Accts, AEC), Todd Class (Asst Dean, NYSID). |
|
| Jan 22
6:30pm | | $15 | | |
| Jan 22
6:30pm | | Free
| | |
| Jan 22
6:30pm | | Free
| | |
| Jan 22
6:30pm | | $40 | | |
| Jan 22
6:30pm | | | | |
| Jan 22
7:30pm | | $30 | | | | | | Friday, Jan 23 |
| Jan 23
8:30am | | $175 | | |
| Jan 23
10:00am | | Free
| | |
| Jan 23
10:00am | | Free
| | |
| Jan 23
12:00pm | | $20 | | |
| Jan 23
2:00pm | | Free
| | |
| Jan 23
9:00pm | | Free
| | | | | | Saturday, Jan 24 |
| Jan 24
10:00am | | | | | | | | Sunday, Jan 25 |
| Jan 25
11:00am | | | | |
| Jan 25
2:30pm | | $20 | | The Harmnf
Caveat, 21 A Clinton St
Written & performed by Kevin (as a robot) Laibson. |
|
| | | WEEK OF JAN 26 | | Monday, Jan 26 |
| Jan 26
12:00pm | | Free
| | |
| Jan 26
3:00pm | | Free
| | Japan Innovation Forum - Tokyo SusHi Night
Japan Society, 333 E 47th St
With Keiichi Yoshimura (Dir. General, Tokyo Metro Govt), Satoshi Katahira (Ambassador, Consulate General of Japan), Jonathan Schulhof (EVP, NYCEDC), Jim Adler (Toyota Ventures), Sahil Jain (SVP, Newlab), Nobuhiro Seki (Monozukuri VC), Deborah Zajac (SOSV/Indie Bio), Tristan Bel (Anywhere VC). |
|
| Jan 26
5:30pm | | Free
| | |
| Jan 26
7:00pm | | $7 | | | | | | Tuesday, Jan 27 |
| Jan 27
3:30pm | | Free
| | |
| Jan 27
6:00pm | | | | |
| Jan 27
6:30pm | | $34 | | |
| Jan 27
7:00pm | | $7 | | | | | | Wednesday, Jan 28 |
| Jan 28
6:00pm | | Free
| | |
| Jan 28
6:00pm | | Free
| | |
| Jan 28
6:00pm | | Free
| | |
| Jan 28
6:30pm | | Free
| | | | | | Thursday, Jan 29 |
| Jan 29
1:30pm | | Free
| | |
| Jan 29
6:00pm | | Free
| | |
| Jan 29
6:00pm | | $45 | | |
| Jan 29
6:00pm | | Free
| | AI Demos
The Refinery at Domino, 300 Kent Ave, Brooklyn |
|
| Jan 29
6:00pm | | Free
| | AI Hacks Back - Build Fast & Safe
Venue, To Be Announced
With Steve Faruque (Product Dir., IBM), Paul Mander (GM, Optery), Anthony Carter (ex-DPC, Advisor, AlphaMille). |
|
| Jan 29
6:30pm | | Free
| | | | | | Friday, Jan 30 |
| Jan 30
5:00pm | | Free
| | |
| Jan 30
5:00pm | | Free
| | | | | | Friday, Feb 06 |
| Feb 06
12:00pm | | $100 | | | | | | Thursday, Feb 12 |
| Feb 12
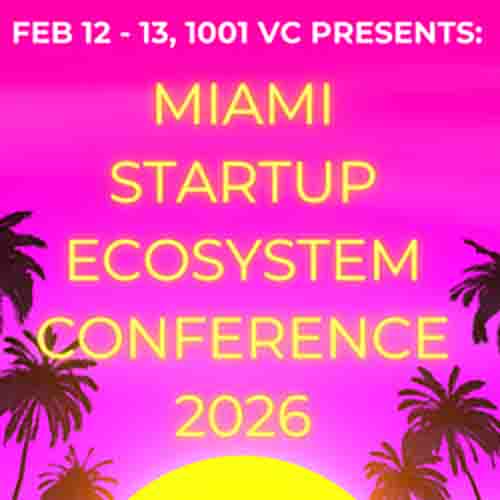
9:00am | | $149 | | Miami Startup Ecosystem Conference 2026 By 1001 VC
Venue, To Be Announced
2 day, high density gathering w/ 23 speakers from Silicon Valley, New York, Boston, FL, DC, ATL incl. VCs, exceptional founders & tech execs. 250 Attendees from across the US & worldwide. No fluff. Actionable insights, key relationships, Miami vibes! |
| | | | Wednesday, Feb 18 |
| Feb 18
6:00pm | | Free
| | | | | | Friday, Feb 20 |
| Feb 20
10:00am | | Free
| | | | | | Saturday, Feb 21 |
| Feb 21
9:00am | | Free
| | |
| | | WEEK OF FEB 23 | | Monday, Feb 23 |
| Feb 23
7:00pm | | Free
| | | | | | Thursday, May 07 |
| May 07
9:00am | | | | AI Hot 100 Summit
Civic Hall, 124 E 14th St
The who's who of enterprise AI. 150+ AI execs. 100+ AI founders. 100+ VC partners & AI labs. All in one room. Themes include voice AI, financial services, healthcare, retail & horizontal agentic/infrastructure. The only AI summit built for real relationships. |
|
| | |
| | | | |
|